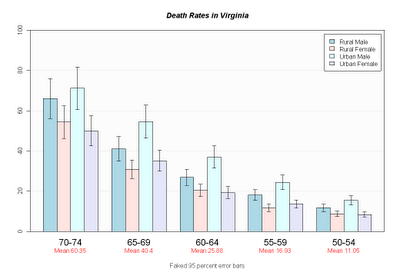
hh <- t(VADeaths)[, 5:1]
ci.l <- hh * 0.85
ci.u <- hh * 1.15
mb <- barplot(hh, beside = TRUE, ylim = c(0, 100)
, col = c("lightblue", "mistyrose","lightcyan", "lavender")
, main = "Death Rates in Virginia", font.main = 4
, sub = "Faked 95 percent error bars", col.sub = "gray20"
, cex.names = 1.5
, legend.text = colnames(VADeaths), args.legend = list( bg="white" )
, panel.before = {
rect( xleft=par()$usr[1], ybottom=par()$usr[3], xright=par()$usr[2], ytop=par()$usr[4]
, col="gray99" )
grid( nx=NA, ny=NULL ) # horiz grid only
box()
}
, xpd=F )
arrows( x0=mb, y0=ci.l, y1 = ci.u, angle=90, code=3, length=0.05 )
mtext( side = 1, at = colMeans(mb), line = 2,
text = paste("Mean", formatC(colMeans(hh))), col = "red" )
Keine Kommentare:
Kommentar veröffentlichen