Donnerstag, 23. September 2010

Reduce margin between plot region and axes with xaxs, yaxs

# get some data
x.i <- seq(0,1,length=5); y.i <- c( 0,0.1,0.2,0.8,1)
par(mfrow=c(1,2))


plot( y=y.i, x=x.i, type="s", panel.before=grid())
symbols( x=0, y=0, circles=0.12, inches=F, add=T, xpd=T, bg=rgb(0,0,1,0.2) )


plot( y=y.i, x=x.i, type="s", xaxs="i", yaxs="i")
grid(); box()
symbols( x=0, y=0, circles=0.12, inches=F, add=T, xpd=T, bg=rgb(0,0,1,0.2) )


Dienstag, 21. September 2010

Find most frequent elements

# the vector
x <- sample.int( n=10, size=20, replace=TRUE )
# the 3 most frequent elements
names( head( sort(-table(x)), 3 ) )
# the 3 most frequent elements with their frequencies
head( sort(-table(x)), 3 )

Freitag, 3. September 2010

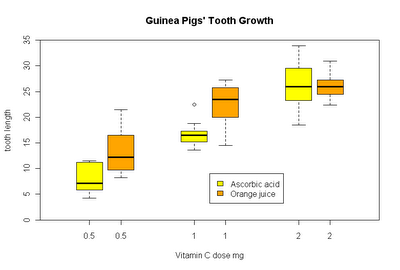
Groupwise boxplot

Groupwise boxplots can easily be created by means of the formula interface.

boxplot(len ~ supp*dose, data = ToothGrowth,
        main = "Guinea Pigs' Tooth Growth",
        xlab = "Vitamin C dose mg", ylab = "tooth length",
        col=c("yellow", "orange") 
        )

Why an outdated method is described in the boxplot help is however not directly clear. Maybe we are glad to know about the technique anyway someday...

boxplot(len ~ dose, data = ToothGrowth,
       boxwex = 0.25, at = 1:3 - 0.15,
       subset = supp == "VC", col = "yellow",
       main = "Guinea Pigs' Tooth Growth",
       xlab = "Vitamin C dose mg",
       ylab = "tooth length",
       xlim = c(0.5, 3.5), ylim = c(0, 35), yaxs = "i")

boxplot(len ~ dose, data = ToothGrowth, add = TRUE,
       boxwex = 0.25, at = 1:3 + 0.15,
       subset = supp == "OJ", col = "orange")

legend(2, 9, c("Ascorbic acid", "Orange juice"),
      fill = c("yellow", "orange"))

SQL-OLAP in R

How to generate SQL-OLAP functions in R:

d.frm <- data.frame( x=rep(1:4,3), g=gl(4,3,labels=letters[1:4]) )

# SQL-OLAP: sum() over (partition by g)
# (more than 1 grouping variables are enumerated like ave(..., g1,g2,g3, FUN=...)):
d.frm$sum_g <- ave( d.frm$x, d.frm$g, FUN=sum )


# same with rank (decreasing):
d.frm$rank_g <- ave( -d.frm$x, d.frm$g, FUN=rank )
d.frm


# get some more data
d.frm <- data.frame(
  id=c("p1","p1","p2","p2","p2","p3","p2","p3","p1","p1","p2"),
  A=c(0,1,1,1,0,0,0,0,0,0,0),
  B=c(1,0,0,0,0,0,0,0,0,0,0),
  C=c(0,0,0,0,1,1,1,0,1,1,1)
)

# get rownumber by group, based by original order
d.frm$rownr <- ave( 1:nrow(d.frm), d.frm$id, FUN=order )

# get some groupwise aggregation on more than one column 
d.frmby <- data.frame( lapply( d.frm[,-c(1,5)], tapply, d.frm$id, "max", na.rm=TRUE ))

# (see also 'Split - Apply - Combine' post)