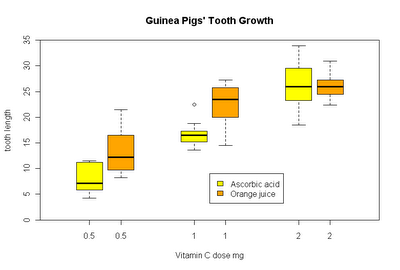
Groupwise boxplots can easily be created by means of the formula interface.
boxplot(len ~ supp*dose, data = ToothGrowth,
main = "Guinea Pigs' Tooth Growth",
xlab = "Vitamin C dose mg", ylab = "tooth length",
col=c("yellow", "orange")
)
Why an outdated method is described in the boxplot help is however not directly clear. Maybe we are glad to know about the technique anyway someday...
boxplot(len ~ dose, data = ToothGrowth,
boxwex = 0.25, at = 1:3 - 0.15,
subset = supp == "VC", col = "yellow",
main = "Guinea Pigs' Tooth Growth",
xlab = "Vitamin C dose mg",
ylab = "tooth length",
xlim = c(0.5, 3.5), ylim = c(0, 35), yaxs = "i")
boxplot(len ~ dose, data = ToothGrowth, add = TRUE,
boxwex = 0.25, at = 1:3 + 0.15,
subset = supp == "OJ", col = "orange")
legend(2, 9, c("Ascorbic acid", "Orange juice"),
fill = c("yellow", "orange"))
Freitag, 3. September 2010
Abonnieren
Kommentare zum Post (Atom)

Keine Kommentare:
Kommentar veröffentlichen